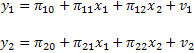
Suppose that the correct model is given by ![]() . As it happens x1 and x2 are not orthogonal; that is, they are correlated. For some reason we are unaware that this is the correct model and we omit x2. The model that we are now working with is
. As it happens x1 and x2 are not orthogonal; that is, they are correlated. For some reason we are unaware that this is the correct model and we omit x2. The model that we are now working with is ![]() . The result is that x2 becomes part of the error term. Moreover, x1 is now correlated with the error term. The consequence, as we already know, is that OLS is neither unbiased nor consistent.
. The result is that x2 becomes part of the error term. Moreover, x1 is now correlated with the error term. The consequence, as we already know, is that OLS is neither unbiased nor consistent.
The remedy is to find another variable, z, that has the following properties:
![]()
![]()
![]()
When z has these properties we refer to it as an instrumental variable. Can you explain why these three properties are important? Are the first and third redundant? Your answer to these questions leads to the conclusion that a proxy used for the omitted variable problem would be a poor instrument.
How can we use an instrument to estimate the slope coefficient and what are the properties of the estimator?
An IV Estimator
Begin by thinking in terms of the covariance between z and the left hand and right hand side of our working model.
![]()
These covariances are population moments. Two of the covariances are zero for obvious reasons. The remaining non-zero terms can be rearranged to get
![]()
We didn't include a hat on the slope because this is 'the truth', not an estimate, since it is stated in terms of the population moments. The sample analog would be
![]()
Using the law of large numbers, as we did for OLS, this estimator can be shown to be consistent. If the instrument doesn't satisfy the covariance assumptions that we stated at the outset, then this new estimator is not consistent.
Inference
The variance of the estimator is ![]() and the sample analog for purposes of doing t-tests is
and the sample analog for purposes of doing t-tests is ![]() . The R2 is the coefficient of determination for the regression of x1 on z. You already know the definitions of the other entries. Construction of the t-test would proceed in the usual fashion, but keep in mind that the statistic is only asymptotically a tdistribution.
. The R2 is the coefficient of determination for the regression of x1 on z. You already know the definitions of the other entries. Construction of the t-test would proceed in the usual fashion, but keep in mind that the statistic is only asymptotically a tdistribution.
Multiple Regression
The IV estimator can be scaled up to many RHS variables. Lucky for us the programmers and mathematicians have worked out the details for our software.
A circumstance under which a RHS variable can be correlated with the error is that in which it is itself an endogenous variable in another relationship. Our real interest is in the equation (1)
![]() (1)
(1)
On the RHS we have the variable y2, which is endogenous in the relationship specified in equation (2)
![]() (2)
(2)
Since y2 is a random variable as evinced in (2), it must by definition be correlated with the error in equation (1). Our intuition, correct as it happens, is that the coefficients of equation (1) can be estimated by a procedure that mimics the instrumental variables estimator introduced above. In fact, equation (2) provides the instruments. The variables of equation (2) satisfy the covariance assumptions that we proposed in the previous section. But notice that equation (1) and equation (2) share a common explanatory variable, x1. This adds a wee bit of a wrinkle to being able to estimate (identify) all of the coefficients in (1). The wrinkle is that in order identify all of the coefficients in (1) it must be the case that ![]() . If this were not so then upon substitution of (2) into (1) we would have an equation that contained only x1 and its coefficient would be a mash-up of different coefficients.
. If this were not so then upon substitution of (2) into (1) we would have an equation that contained only x1 and its coefficient would be a mash-up of different coefficients.
Equation (1) is known as a structural equation because it has a behavioral variable on the RHS. It is possible to substitute equation (2) into (1) and obtain a result known as the reduced form equation. The reduced form for the variable y1 would be
![]() (3)
(3)
![]() (4)
(4)
![]() (5)
(5)
![]() (6)
(6)
You will note that in (6) the RHS are all uncorrelated with the composite, or reduced form, error, v1. We can estimate the three unknowns in equation (6) using OLS and have all the desirable properties of that estimator. As it is, estimating (6) wouldn't tell us what we really want to know, which is the coefficients in (1). We would need to estimate the coefficients of (2) and combine those results with what was found for (6) in order to have six equations in the six unknowns.
There is a more direct method to get the same information. Equation (1) is in the same spirit as our first exposure to IV estimation: There is a variable on the RHS that is correlated with the error term. What could we use as an instrument for y2 in (1)? A good candidate would be the fitted values of y2 from equation (2) since these fitted values would, by construction, follow the covariance assumptions we introduced at the beginning of this section.
To summarize the operation as a recipe:
1. Estimate the coefficients of ![]() .
.
2. Save the fitted values from step (1) and call them y2_hat, or, symbolically ![]() .
.
3. Estimate the unknowns of the equation ![]()
Since this is implicitly the same as our IV procedure, we know that our estimator is consistent and asymptotically efficient.
We'll just use some simple examples. Two variables, y1 and y2, are jointly determined. An example would be the fact that we are taught in principles of economics that price and quantity are jointly determined by the supply curve and the demand curve.
![]() (7)
(7)
What assumption of basic regression is violated in this model?
Why don't we just apply OLS to each of the structural equations?
The explanation is as simple as that which we used to illustrate the classic errors in variables problem. For the current multiple regression case the algebra is a little messy, but if we were persistent we would find that the OLS estimators are equal to the 'truth' plus some weighted covariances that do not vanish in expectation or in the limit.
The reduced form is found from the structural system by solving the two equations for the two endogenous variables in terms of the exogenous variables.

|
 (9)
(9)
As before, we can estimate each of the reduced form equations' coefficients using OLS since these equations each conform to our basic assumptions regarding relevant correlations. In case you haven't guessed it, we can use the fitted dependent variables from the reduced form in place of their observed counterparts on the RHS in the structural models. But in order to do so we need to deal with one more problem.
If you look at the simple structural model that we proposed in the system of equations (7) you will see that there are six unknowns. When you count the estimable coefficients in the reduced form system (9) there are also six results. Six equations -- six unknowns, seems like we're done. Just hold on. There are some technical considerations. A very simple example can be used to make the same point:
Consider the simple macroeconomic model
 (6.1)
(6.1)
C is consumption, Y is real GDP and I is investment and is assumed to be non-stochastic. Substituting and solving for the two behavioral variables
 (6.2)
(6.2)
In our model (6.1) is known as the structural system and (6.2) is known as the reduced form.
The first problem that we encounter in systems models is best addressed by rewriting the reduced form and doing a bit of tedious algebra.
 (6.3)
(6.3)
Applying OLS to these equations we can estimate the set of ps consistently since the RHS variable is independent of the error term. Referring back to (6.2) we see that we can construct an estimate of b from two different equations. For this example the numerical results will be identical. Can you prove it?

In this example in which the two numerical results are the same we are lucky, the first equation is said to be identified.
The second problem that we encounter in systems models has to do with properties of estimators. It is illustrated by continuing the example. Suppose that we apply OLS to (6.1) to obtain an estimate for b
![]()
Both Yt and Ct are random variables so it is hard to evaluate ![]() . We can, however, evaluate the probability limit.
. We can, however, evaluate the probability limit.

Consider first the denominator

which was derived by substituting from (6.2). So
![]()
Turning now to the numerator

Putting the pieces back together

In the context of the model we are considering, we know that the MPC, b, is between zero and 1. We can see from the above result that even in large samples we over-estimate b.
1. The order condition requires that each structural equation exclude a number of system exogenous variables equal to the number of endogenous variables included on the RHS of that equation.
2. The rank condition requires that the matrix of reduced form coefficients in (8) have rank at least as great as the number of endogenous variables in the system.
EXAMPLE 1 An Underidentified System
We have a demand equation and a supply equation, respectively:

in which the exogenous variables are denoted by Z, and the endogenous variables are P and q. Writing things in matrix form

The reduced form is found as follows

After doing all the algebra we come up with

Note:
1. We have four equations in six unknowns from the reduced form equations.
2. Alternatively

The rank of the matrix of the reduced form coefficients is not 2, it is only 1.
3. Also, in each equation of the structural model we have 2 included endogenous variables and no excluded exogenous variables.
The issue of rank and counts of included endogenous and excluded exogenous variables will prove crucial in our discussion of the identification problem.
EXAMPLE 2 An Exactly Identified System

Writing things in matrix form

The reduced form is as follows

Note:
1. Now we have 6 equations and 6 unknowns from the reduced form.
2. The rank of ![]() is 2 and the number of endogenous variables is 2.
is 2 and the number of endogenous variables is 2.
3. In each structural equation we have an excluded exogenous and 2 included endogenous variables.
EXAMPLE 3 An Overidentified Macroeconomic Model
The model has three equations. Two of them are behavioral: consumption, c, and investment, i. The third is the national income,y, identity that expenditures must equal income in equilibrium. The exogenous variables include the interest rate, r, government spending, g, lagged consumption, c-1, and lagged income, y-1. The structural model is

Since the last equation is an identity, e3 is a degenerate random variable. That is, its variance is zero.
The reduced form, which you could derive with a pencil and paper or using a program like Mathematica or MathCAD, is as follows

Note:
1. There are 15 equations in 7 unknowns in the reduced form.
2. The rank of P is three and there are three endogenous variables.
3. There are two included endogenous variables in each equation of interest. The first equation has 3 excluded exogenous, the second has equation has 2 excluded exogenous, and the third equation has 4 excluded exogenous variables.
When we started out we proposed the model
Two questions should come to mind:
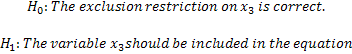
Question 1. How do we know that in the first equation x1 is not endogenous?
Question 2. Again, with reference to equation 1, how do we know that there isn't another exogenous variable, call it x3, that we are using as an instrument, but which rightfully belongs in the first equation as an included exogenous variable? x2 has been excluded from the first equation through an identifying restriction.
Naturally, these are both testable propositions.
Recipe for Question 1:
H0: x1 is exogenous
H1: x1 is endogenous
1. Estimate the first equation as though x1 is exogenous. If x1 is exogenous then you could us 2SLS and without using your list of instruments to create a ![]()
. Use ![]() to designate the 2SLS estimate of
to designate the 2SLS estimate of ![]() when x1 is thought to be exogenous.
when x1 is thought to be exogenous.
2. Estimate it again treating x1 as though it is endogenous; niow you will need instruments for x1. If x1 is endogenous then you should use 2SLS. Use ![]() to designate the new 2SLS estimate of
to designate the new 2SLS estimate of ![]()
3. Construct a chi-square test for the null hypothesis as ![]() . For our example there is one degree of freedom.
. For our example there is one degree of freedom.
Recipe for Question 2:
For the purposes of our recipe we suppose the model is
![]()
with the additional exogenous variable x3 whose sole purpose is thought to be as an instrument for the endogenous variables. Hence the null and alternate can be written as
1. Estimate the equation of interest as though it was correctly specified using, say, 2SLS. In this step you use as instruments x1, x2, and x3, although x1 is the only included exogenous variable. If x3 has been incorrectly excluded from the specification then 2SLS is not consistent because x1 will be correlated with the error.
2. Save the residuals from step 1 and call them res01.
3. Run the regression with res01 on the LHS and ALL of the exogenous variables on the RHS.
4. For the regression in step 4 compute the coefficient of determination and multiply by the sample size. This statistic is chi-sq with degrees of freedom equal to the number of excluded exogenous variables minus the number of endogenous on the RHS of the equation of interest.
 (8)
(8)